
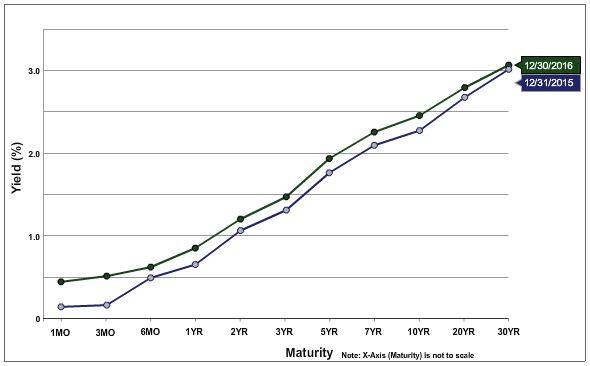
U.S. Treasury Yield Curve December 30, 2016 vs. December 31, 2015
Although interest rates still seem on the low side by all but the youngest players in the market, interest rates nonetheless have made a sharp upturn in recent months. Consider that 10-year yields are near a 5 year high and more than 50% higher than the lower levels during the same period. Shorter term yields, specifically the 2-year, have likewise increased from near zero over the past several years to a bit over 1.2%.
These moves are less evident in the accompanying “U.S. Treasury Yield Curve December 31, 2016 vs. December 31, 2015” chart as rates at the end of 2015 were also in the higher end of their 5 year range. This uptick is more visible in the second chart, U.S. Treasury Rates 2-year and 10-year in the ten years from 12/31/2006 to 12/31/2016.
Higher rates are generally not good for commercial real estate investors for a set of reasons (see this, this, and this). As the cost of money to finance transactions increases, it lowers the demand side for property and thus tends to negatively affects pricing. Investors also expect a higher return on their commercial property investments given higher returns available on fixed income alternatives, thus pushing up cap rates, i.e. pushing prices down relative to their net operating income. In summary, the interest rate environment is very important to commercial property investment. It is important to note, however, that interest rate, although making a bit of a head turning uptick of late, remain historically low.
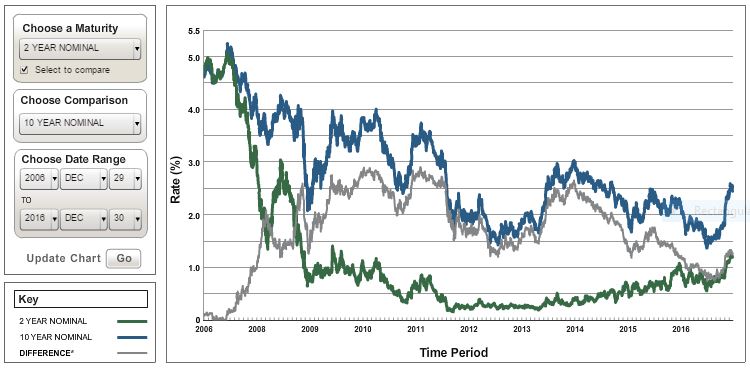
U.S. Treasury Rates 2-year and 10-year 12/31/2006 to 12/31/2016
To provide additional context to the current interest rate environment, the second aforementioned chart (U.S. Treasury Rates 2-year and 10-year 12/31/2005 to 12/31/2015) is of rates for the 2-year (green line) and 10-year (blue line) treasuries over the prior decade. The grey line is the difference between the two.