
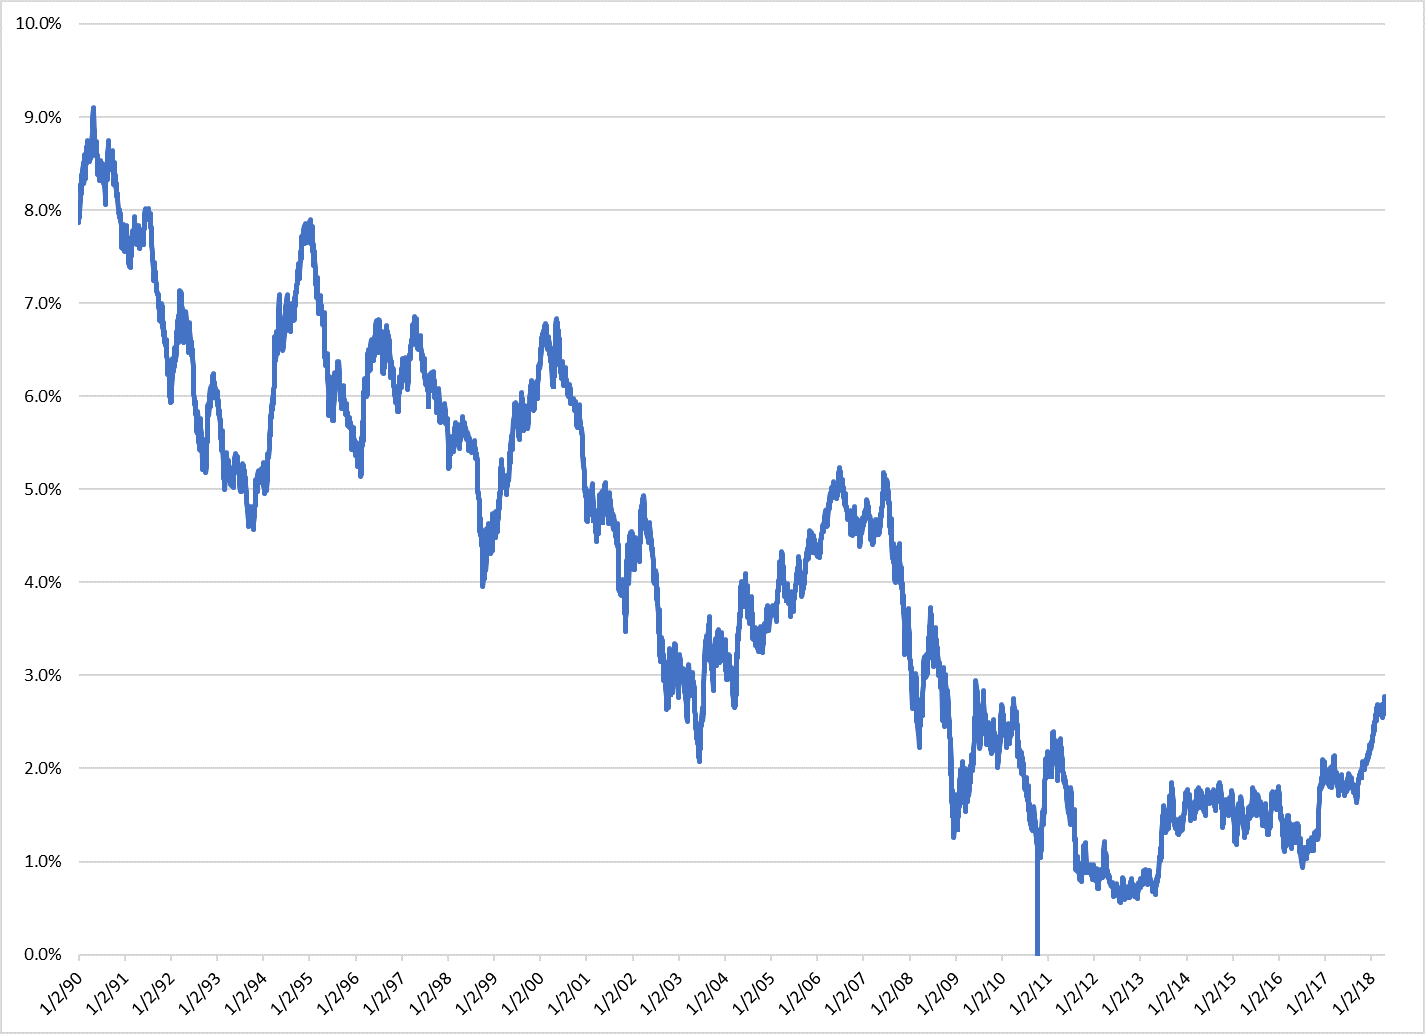
5-Year United States Treasury Rates from January 1990 to April 2018
Given the rise of late in interest rates, it seemed an opportune time to put rates, particularly those of the 5-Year United States Treasury most closely linked to commercial property borrowing rates, into perspective. The accompanying chart, “5-Year United States Treasury Rates from January 1990 to April 2018,” gives a nice visual perspective. In this chart, it is immediately apparent that this rate, and thus commercial property borrowing cost, has crept up a general range not seen since 2011, but still is comfortably below ranges from which is declined steadily since 1990.
Related Resources: