
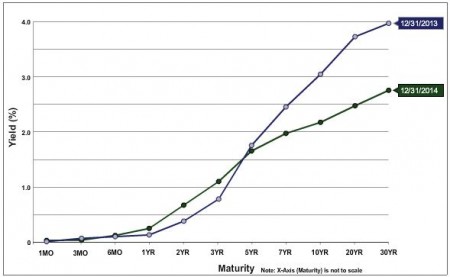
U.S. Treasury Yield Curve December 31, 2014 vs. December 31, 2013
The U.S. Treasury yield curve ended 2014 relatively unchanged from a year prior in the 5-year and shorter maturities, with rates lower in longer maturities, more than 100 basis points for 20 years and longer. This can be seen clearly in the accompanying “U.S. Treasury Yield Curve December 31, 2014 vs. December 31, 2013” chart. The biggest increase versus the year prior was in 20-year treasuries. In summary, shorter maturities were relatively unchanged, while longer term rates declined.
This is a positive environment for commercial real estate investors, as the cost of financing transactions (interest expense) remains on the low end historically.
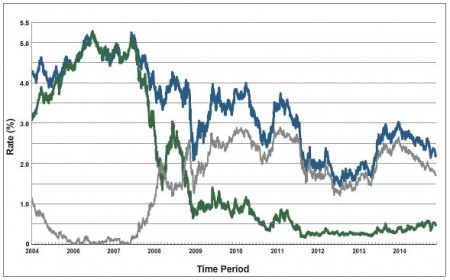
U.S. Treasury Rates 2-year and 10-year 12/31/2004 to 12/31/2014
The second chart (U.S. Treasury Rates 2-year and 10-year 12/31/2004 to 12/31/2014) puts this in a longer term context. This chart displays rates for the 2-year (green line) and 10-year (blue line) treasuries over the prior decade. The grey line is the difference between the two. Over this longer period, longer rates have steadily declined, while shorter term rates plummeted in 2007 to 2008, and have remained near zero since.