
The question comes up as to how frequent a commercial property trades in the Miami area. Many take a guess at this, but which I’ve never heard of anyone else really making an effort to truly quantify it. I’ve taken a swing at it here.
The Methodology
The value of what trades as a percentage as the numerator (selling prices) is not disclosed for many trades and in any case it is a different measure than any accessible denominator. What is accessible, however, is the Miami-Dade property appraiser’s (MDPA) value today for folios (parcels) that have traded in the past. By comparing 2021 MDPA values for traded commercial folios in prior years with total 2021 MDPA values for all commercial folios, it can give us a fairly accurate idea of turnover in those years. Note here I’m using county-wide numbers to represent the greater Miami area. Obviously, some areas will have had more turnover than others.
One fault in this is that the Miami area is growing, thus the square footage of improvements would have been less in prior years. However, these improvements will be reflected in the 2021 MDPA values. Thus, using MDPA 2020 values seems reasonably apples to apples, though perhaps Granny Smith to Gaia. Also, there will be properties that have gone in or out of a commercial classification. Those that have traded, however, will not be reflected at all, and thus should have no significant effect on the percentages. What is being counted here is properties that we’re identifying as commercial now that have traded in the past 5 years. Take into account the variances and you’re left with apples to pears, not perfect, but better than apples to unicycles (just a random choice there), and far better than any other calculation of which I’m aware.
It seems to be reasonable to assume that this is a pretty good way to gauge turnover or the past few years. Using such a method to go back farther, however, would surely result in less valid percentages for the years farther back, eventually excessively so.
“Four out of three people struggle with math.”
~Anonymous*
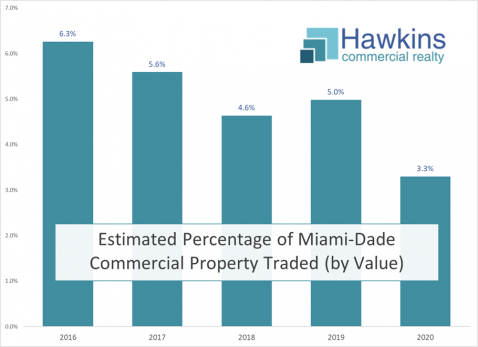
It is also worth noting that the drop-off in 2020 is greater than I would have guessed. Prior to 2020 turnover seems to run about 5-6%, which I’ll guess is a normal run rate. I would assume the 2021 drop is attributable to COVID, and further expect (this is a guess) that this is disproportionately attributable to larger trades. I’ll further guess that turnover for 2021 will be considerably higher than any of these prior years. I’ll play oddsmaker for a moment and call the over-under 8.5%.
* That’s my story and I’m sticking to it.