
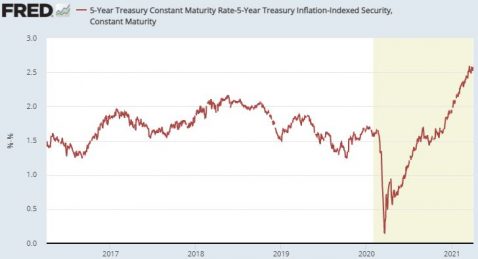
The TIPS spread is the difference in the yields between United States Treasury bonds and Treasury Inflation-Protected Securities (TIPS). It is a useful and oft-quoted measure of expectations for (CPI) inflation in the financial markets. The spread indicates expected inflation.
Real money is buying these bonds. TIPS pay interest every six months, based on a fixed rate that is calculated by multiplying the adjusted principal by one-half the calculated interest rate (i.e. half a year’s worth of inflation at that rate). Thus, a “bet” that an investor makes in with these bonds has real financial implications.
As one can see in this chart, this spread has been on a somewhat rapid and steep ascent since its pandemic related plummet in early 2020. It has not reached its highest level in the 5 year period on this chart. In fact, if one looks back farther, it is at the highest level it has been since July 2008, nearly 13 years prior. That is a concern, but even more of a concern is whether the end of this ascent might be a ways up from here.
Alert level? Yellow.
Watch this.