
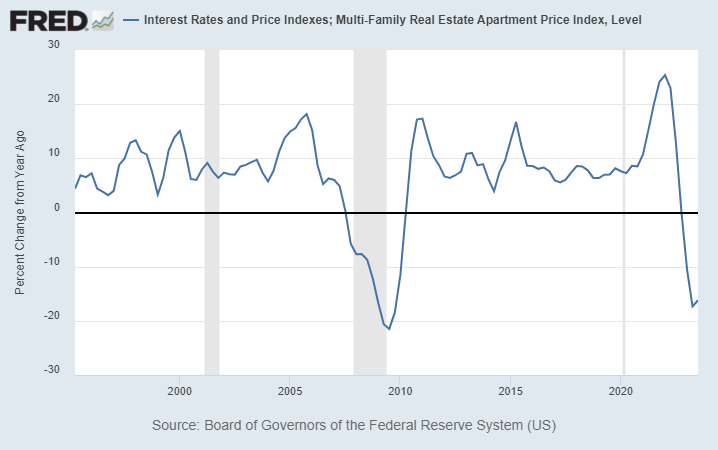
Multifamily Prices Nationally Have Dipped Nearly 17% from a Year Prior, a Drop Near That of the Great Recession of 2008
In the chart above of the Federal Reserve’s Multi-Family Real Estate Apartment Price Index,, retrieved from FRED (Federal Reserve Bank of St. Louis) on February 9, 2024, one can see that multifamily prices have recently declined considerably. What also stands out is that this level of decline has only happened one other time since 1996, and that was in the recession of 2008, commonly referred to as the Great Recession.
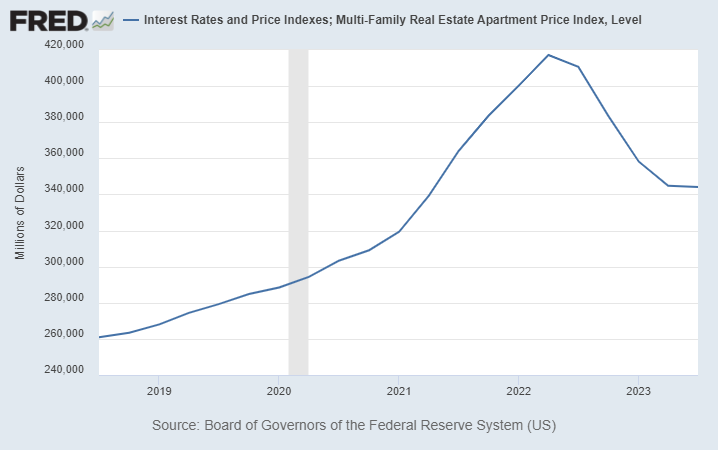
The Index has Declined 17.63% from it 2022 Q2 High of $417,220 to $344,116 (millions) in 2023 Q3
This second chart shows the index itself with the drop from its high in the second quarter of 2022 to the third quarter of 2023 matching the percentage change in the prior chart. When one considers how leverage will multiply this effect on equity, with 50% loan to value before the drop resulting in a 35.26% decline in equity from the decline, the balance sheet stress for some multifamily investors must be feeling is abundantly apparent.
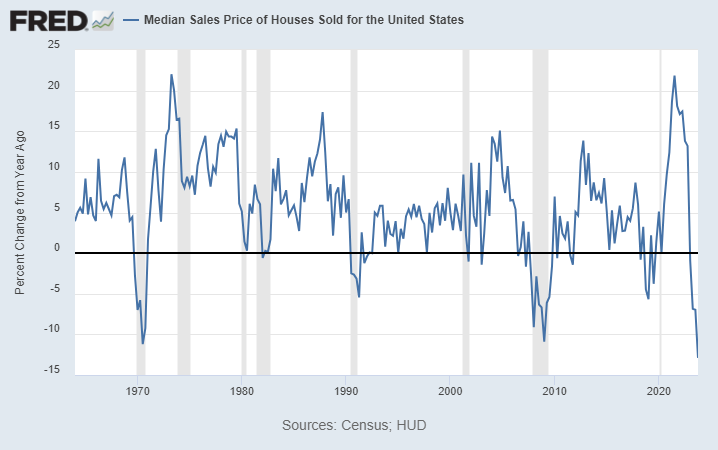
Median Home Sales Prices Have Had Their Biggest Decline Ever as Recorded by FRED
The decline in home prices, a competing residence option versus (renting from) multifamily, is greater than in the aforementioned Great Recession, and in fact is the biggest decline in this 60 year dataset, as can be seen in the FRED data.
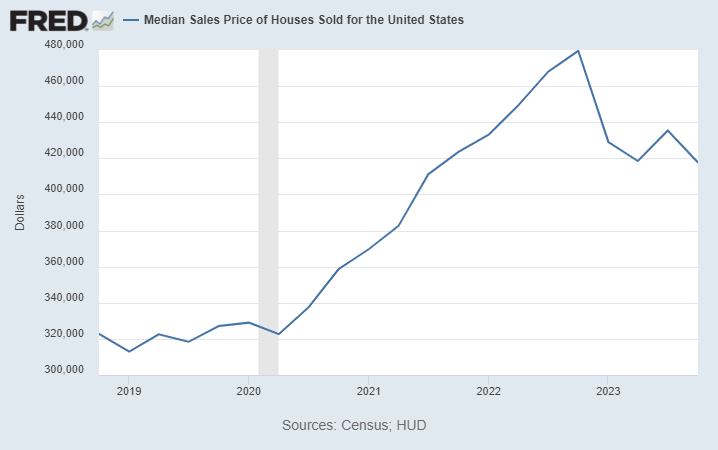
Median Sales Prices of Houses Sold has Declined 12.88% from it 2022 Q4 High of $449,500 to $417,700 in 2023 Q4
Financing Cost Effects
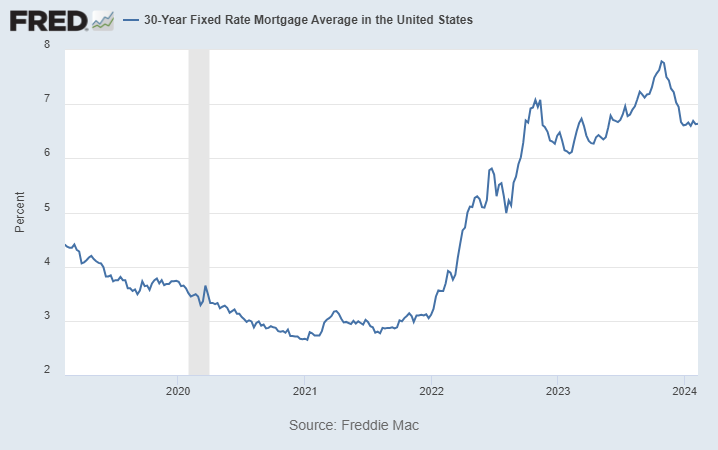
After Hanging Under 3% for Most of 2020 to 2021, 30-Year Fixed Mortgage Rates Have More Than Doubled to 6.64% in February 2024
These price moves are surely the result of higher interest rates. An increase of rates from 3% to 6% increases principal and interest payments for a 30 year mortgage by 42.9%. That effect will be felt by any owners that are forced to refinancing in this environment. Buyers are affected by it now as they consider purchases. The borrowing power of a given level of net operating income, using the same change in rates from 3% to 6$ with a 30 year amortization, is reduced by 30%. Also, the spread between the cost of money and the cap rate goes against a buyer unless prices move (and as per the chart, they have). Finally, the amount of leverage that can be used is reduced, reducing the attractiveness for buyers. During the heydays, when rates were at their lowest, I found there was a batch of buyers motivated principally by cash on cash returns, pre-tax (post debt service) cash flow as a percentage of cash/equity invested, kind of the multifamily equivalent of the carry trade. That’s a strategy that works until it doesn’t.
But What of Miami Area Multifamily?
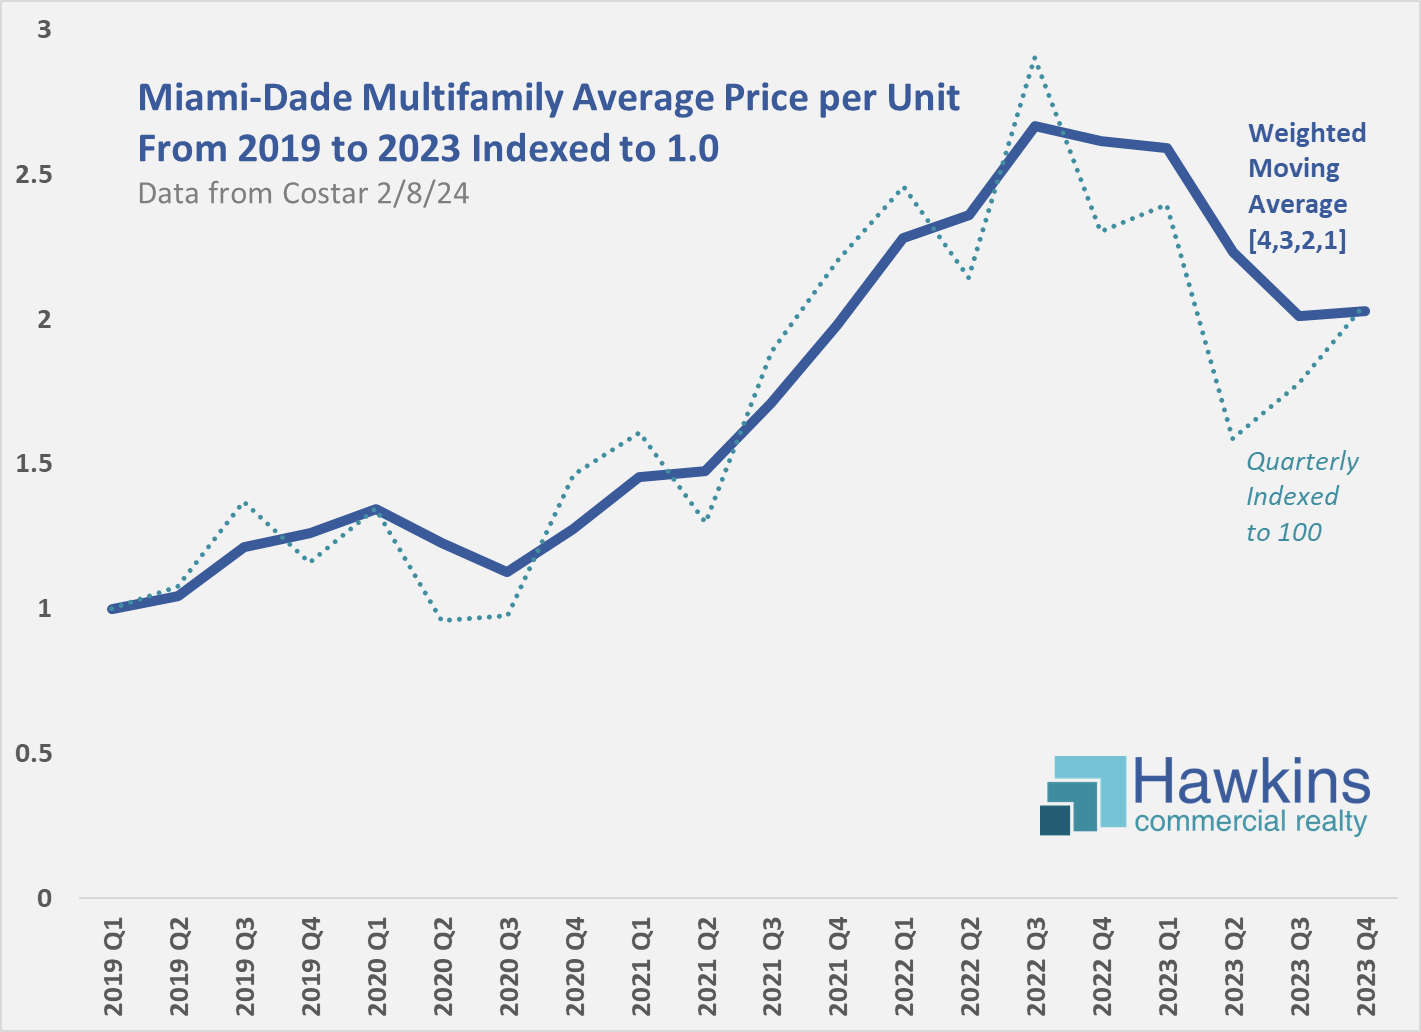
Miami Multifamily Prices Appear to Have Declined Considerably as Well
The sample size drops as one starts to look at this locally, resulting in noisier data. To reduce the “noise,” in the chart above average prices per multifamily unit are considered on a weighted moving average basis. The current period is given a weight of 4, the prior 3, then 2 for the one prior to that, and finally 1 for the 3 periods prior. This has some of the smoothing effect of a 4 quarter moving average while allowing moves in a current period to have more impact.
Working with the weighted moving average numbers, prices in Miami-Dade appear to have declined as they have nationally. I wonder, however, if given the incredible rent growth in Miami during that period, the decline is in actuality less, that the drop reflected in the data is due to better classes of buildings trading in the earlier data than in the later data. Prices throughout the county vary widely, after all. Nonetheless, Miami multifamily has clearly not been immune to the price chilling effects of higher financing costs.
Resources Related to Multifamily: