
View in Google Maps
View in Google Maps
Above is a color coded (by PSF price range) chart of vacant commercial land sales per square foot in 2017 for land located within Miami-Dade. Below this is another map with the same properties mapped, but with each icon containing links to detailed information about the properties. This data aset was prepared using data from Costar. It is not comprehensive as not all land sales are recorded in this data source.
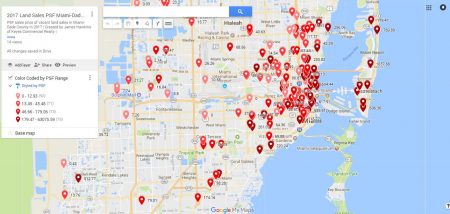
Viewing the color coded by PSF land sales chart directly in Google Maps allows for more useful views, better zooming, and viewing of related legends
You may zoom in and out of these maps, and pan around them to look at different areas. For a better experience, however, we recommend viewing these in Google Maps by using the links below each map or by clicking the full screen icon on either map.