
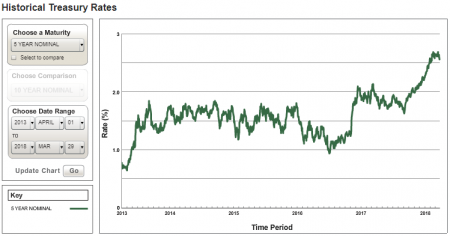
Five Year United States Treasury Yield January 1, 2013 to March 31, 2018
On a quarterly basis we publish a yield curve update, showing the shift is the U.S. Treasury Yield Curve at the end of a quarter over the prior quarter. What is more directly of interest to commercial real estate investors, however, is the 5 year U.S. Treasury yield, given its relationship both to commercial borrowing costs, with many if not most commercial lenders tying rates to this yield, and cap rates, which tend to move with this rate over time, albeit only somewhat. Further, what tends to be of interest is not only where this rate is versus the quarter prior, but where it is versus the past, at least the last several years. The “Five Year United States Treasury Yield January 1, 2013 to March 31, 2018” chart addresses this directly, displaying yields for the last full five calendar years plus year to date.
Relating this to Commercial Borrowing Costs
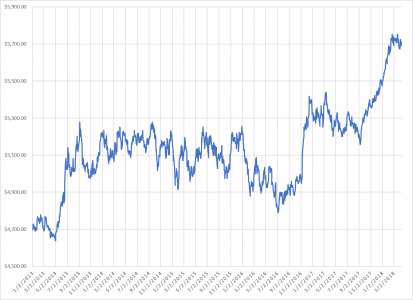
Principal and Interest Per Million Borrowed Assuming 5 Year U.S. Treasury Yield Plus 2.15% Amortized Over 25 Years January 1, 2013 to March 31, 2018
The next step is to relate this, as directly as possible, to its real world impact. Perhaps the most direct effect is the question we are often asked, the one under consideration with any commercial purchase involving financing, that of the effect on principal and interest payments (P&I). This is represented graphically in the second chart herein, “Principal and Interest Per Million Borrowed Assuming 5 Year U.S. Treasury Yield Plus 2.15% Amortized Over 25 Years January 1, 2013 to March 31, 2018.”
During the period represented in this chart, one can see that prior to 2017 the highest P&I amounts per million given these assumptions was around $5,300 ($5,278, to be precise), with the amount hovering around $5,100, give or take. Then, in 2017, it too a bit of a jump, then began increasing again, reaching a recent high of $5,753, and of late hovering around $5,700.
Important: This is not a representation of actual borrowing costs, as these are between a borrower and his or her lending institution. It is, however, an apples to apples comparison of P&I alone utilizing the same spread over treasuries convention widely used by institutions to establish lending rates, and thus should provide at least rough insight into the practical effect of changes in intermediate rates.
View more borrowing cost quarterly posts.