
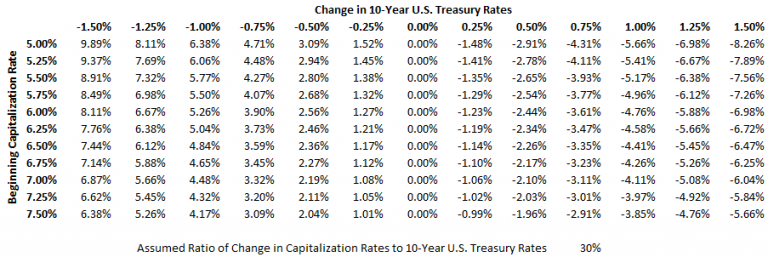
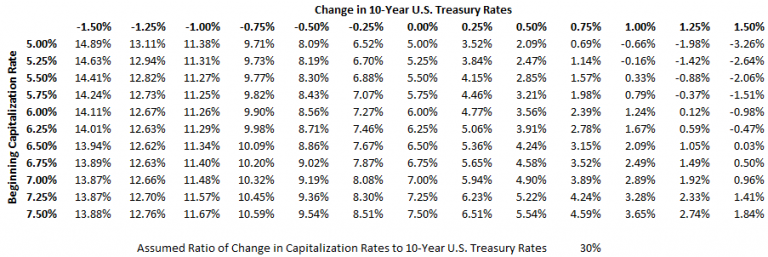
Data Table of Changes in Property Values Given Various Beginning Capitalization Rates (Cap Rates) as 10-Year U.S. Treasury Rates Change Assuming a 30% Ratio of Cap Rate Changes to U.S. Treasury Rate Changes
Within the commercial real estate industry, it is generally accepted that higher interest rates lead to higher cap rates and thus lower values, and vice versa. The data on this suggests that the relationship is looser than frequently perceived. On average, there does appear to be some correlation, with more considered analyses suggesting a 30% or so correlation in cap rate changes to changes in the 10-year U.S. Treasury yields. “On average” has particular significance here, however, as correlations have varied widely over time.
“If something cannot go on forever, it will stop.”
~Herbert Stein
Assuming one day the low interest rate environment to which we have become so accustomed will be replaced by one with higher rates, it is worth considering what the effect, if any, might be on values. I’ll leave thoughts on whether a rise in rates now might result in higher cap rates, and to what extent, to another time, and to other authors (like this, this, and this). For this article, I merely want to give consideration to what would happen to values if a) rates on 10-year U.S. Treasuries move by some ratio and b) cap rates move the same direction, but 30% as much.
The table at the top of this post displays the results of this calculation, while the charts below render it graphically in different ways. The charts below display the same results. I have chosen to graph it in different ways as people tend to internalize different types of chart formats for (somewhat) more involved data sets like this.
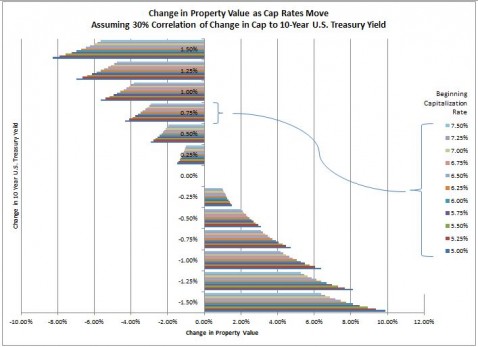
Bar Chart of Changes in Property Values Given Various Beginning Capitalization Rates (Cap Rates) as 10-Year U.S. Treasury Rates Change Assuming a 30% Ratio of Cap Rate Changes to U.S. Treasury Rate Changes
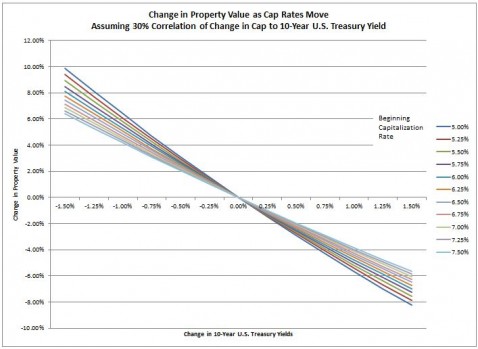
Line Chart of Changes in Property Values Given Various Beginning Capitalization Rates (Cap Rates) as 10-Year U.S. Treasury Rates Change Assuming a 30% Ratio of Cap Rate Changes to U.S. Treasury Rate Changes
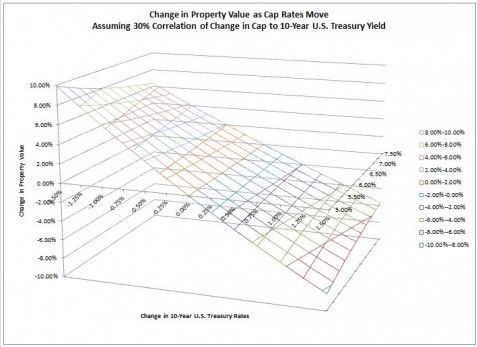
3 Dimensional Contour Chart of Changes in Property Values Given Various Beginning Capitalization Rates (Cap Rates) as 10-Year U.S. Treasury Rates Change Assuming a 30% Ratio of Cap Rate Changes to U.S. Treasury Rate Changes
Of course, changes in value do not represent return with income producing commercial real estate. the cap rate itself may be added to this for a pre-tax total return metric. Adding this return (cap rate), as if calculating a hypthetical total return with cap rates changing over a year, makes the results less negative as cap rates increase.
Data Table of Total Pre-Tax Return (Cap Rate Plus Changes in Property Values Given Various Beginning Capitalization Rates) as 10-Year U.S. Treasury Rates Change Assuming a 30% Ratio of Cap Rate Changes to U.S. Treasury Rate Changes
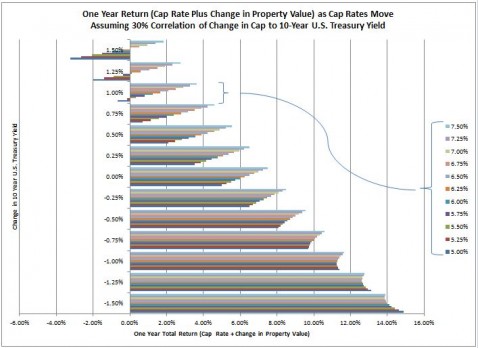
Bar Chart of One Year Return (Cap Rate Plus Changes in Property Values Given) Various Beginning Capitalization Rates (Cap Rates) as 10-Year U.S. Treasury Rates Change Assuming a 30% Ratio of Cap Rate Changes to U.S. Treasury Rate Changes
This is nowhere close to a full story. What investors seek as a cap rate encompasses more about the future than the moment. This is especially applicable in a city like Miami, where NOI (net operating income) growth rate assumptions tend to be higher than most markets. Further, the numerator in the cap rate is NOI, itself affected by rents and vacancy rates. Thus, a low cap rate may be a product of higher vacancy, not higher prices, at least to some extent, perhaps in entirety. What this post and the charts within it do is thus is not comprehensive or conclusive. They instead merely quantify, numerically and visually, what a moderate correlation of cap rate changes to moves in interest rates would mean for property values without taking into consideration other factors.
For information related to cap rate trends in the Miami area, see:
- Cap Rate for Miami-Dade Retail Property Remains Just Under 6%
- Mid-Market Miami-Dade Multifamily Cap Rate Drifts Under 7%