
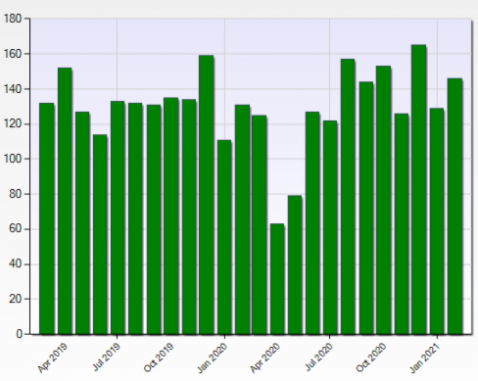
The chart in this post shows the number of closed sales of Miami-Dade commercial properties, including improved commercial property and vacant commercial land, that were recorded in the Miami MLS for the two years ending February 2021. One can see that February was a fairly normal sales month for Miami commercial real estate.
This is only for sales booked in the Miami Multiple Listing Service (MLS). This does not record all commercial property sales, but it records many. Given that it doesn’t record all sales it can’t be said to be perfectly representative of the asset class. Nevertheless, given that it is representative of commercial property sales that have also been so recorded in a prior period versus the current one, i.e. apples to apples, it should be fairly reliable for gauging change.