
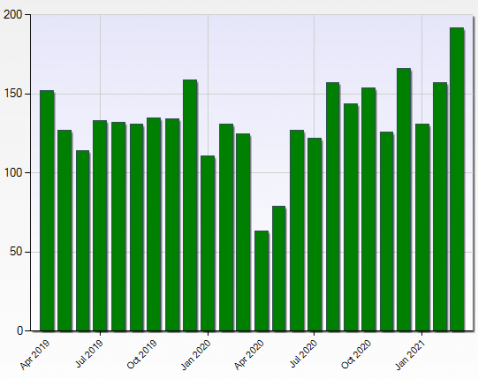
The chart herein displays the number of closed sales of Miami-Dade commercial properties, including improved commercial property and vacant commercial land, that were recorded in the Miami MLS for the two years ending March 2021. March, as can been seen, was a record for the past two years. Looking back farther than the data in this chart, March was a record for the past 10 years. March’s sales were 12% higher than the next highest, which was June 2017. This is only for sales booked in the Miami Multiple Listing Service (MLS), which does not record all commercial property sales, but does many.