
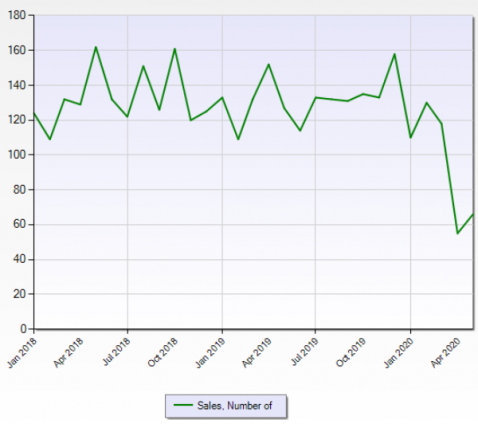
The chart above shows the number of commercial property sales in Miami-Dade county, frequently considered as the general Miami, Florida metro area, for both improved and vacant land that were recorded in the Miami Realtors MLS from January 2018 to May 2020. Though MLS only picks up a portion of commercial property sales, and thus is not fully representative, it nonetheless can be utilized to view trends, particularly where significant. In this chart, one can see that closed transactions declined by about two-thirds in April, then essentially stayed the same in May 2020, increasing ever so slightly.
This surely reflects the continuing effect of COVID-19, which was declared a pandemic on March 11, 2020. This drop in sales is not a surprise to anyone, I would think. The pandemic has had a stun gun type effect on various sectors of the economy; commercial property is no exception.
In April, I noted that the slowing might not be the worst of it given that it remained early. I commented then that anecdotally speaking general transaction related activity dropped nearly 100% for about a one month period, but seemed to be recovering as I was writing that. This leads me to a couple of might-be-light-at-the-end-of-the-tunnel observations.
Commercial property inquiries, a crude metric I personally track, but a metric nonetheless, have rebounded completely from their precipitous drop. Inquiries are not transactions, but they are the feeder for them, thus this is good. Also, a big part of the rebound may be personal, as this metric was in a strong uptrend prior to the coronavirus.
That closed sales in May did not fall further from April levels, in fact even increased, though by “hanging chad” margin (anyone in Florida in 2000 gets it), is further encouraging for anyone wanting valuations to hold up.
Finally, that the ratio of closing price to list price still has not significantly declined is also somewhat encouraging for this cause. In fact, it was down a touch versus the month of April, but remained in its range of 95-ish to 98-ish percent. A technical stock trader might look at this and say it is testing resistance at 95%. A practical person might simply expect this average to be affected by sellers that want to sell and of a sudden find their pool of buyers more limited. In any case, that it remains in a range is notable.