
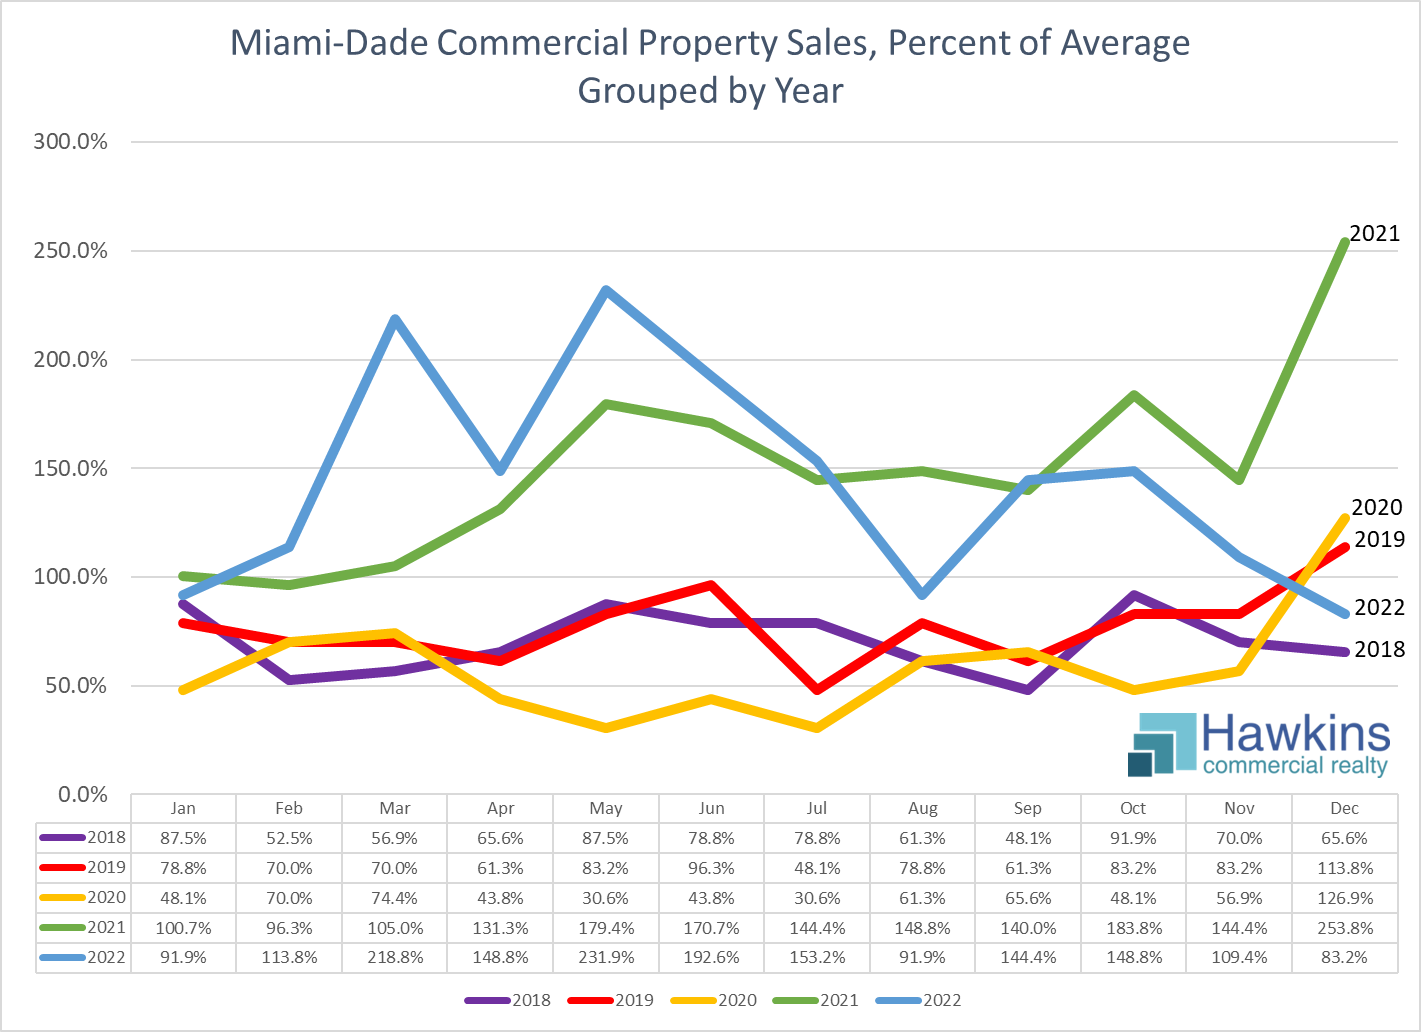
January 2018 to December 2022 Commercial MLS Miami Association of Realtors, Property Types Land-Commercial/Business/Agricultural/Industrial, Commercial/Industrial, within Miami-Dade County, Price $1,000,000+, Calculated from 1,371 Listings, Dataset Obtained 1/10/23
In the chart above, the number of closed sales as a percentage of the five year average is plotted by month, grouped by year; the dataset is displayed just below. The most striking element is the year end surge of 2021, with closed sales exceeded 250% of the average. The next most striking thing is perhaps the surge in the first half of 2022, which is of course really a continuance of late 2021. The third most striking thing is the plunge from elevated levels only five months prior to ones one might refer to as more normal at year end 2022, with closed sales at 83.2% of the average for the prior five years, down from 254% in December 2021 and 153% as late as July 2021.
![Miami-Dade Commercial Property Sales Percent of Average vs. 5-Year US Treasury Yield: January 2018 to December 2022 Commercial MLS Miami Association of Realtors, Property Types Land-Commercial/Business/Agricultural/Industrial, Commercial/Industrial, within Miami-Dade County, Price $1,000,000+, Calculated from 1,371 Listings, Retrieved 1/10/23 | Board of Governors of the Federal Reserve System (US), Market Yield on U.S. Treasury Securities at 5-Year Constant Maturity, Quoted on an Investment Basis [DGS5], retrieved from FRED, Federal Reserve Bank of St. Louis, January 9, 2023.](https://www.hawkinscre.com/wp-content/uploads/2023/01/cmls_commercial_sales_miami_dade_comps_past_5_years_not_grouped_vs_5_year_treasury_b.png)
January 2018 to December 2022 Commercial MLS Miami Association of Realtors, Property Types Land-Commercial/Business/Agricultural/Industrial, Commercial/Industrial, within Miami-Dade County, Price $1,000,000+, Calculated from 1,371 Listings, Retrieved 1/10/23 | Board of Governors of the Federal Reserve System (US), Market Yield on U.S. Treasury Securities at 5-Year Constant Maturity, Quoted on an Investment Basis [DGS5], retrieved from FRED, Federal Reserve Bank of St. Louis, January 9, 2023.
The second chart is of the same data as in the prior chart, but plotted over the entire period, i.e. not grouped by year, and plotted against the rocket fuel for this surge, interest rates, here represented by 5-year US Treasury yields. The surge from around Q2 2021 through Q2 2022 is more evident when viewed this way. Also standing out is the negative correlation between interest rates and commercial property sales, albeit perhaps with a slight lag. What is lost when viewed this way is the year over year, i.e. season versus season, and particularly December versus December, comparison.
Also interesting to note is that that this is the number of closed sales as a percentage of the five year average, with that average itself elevated by the results during the sales surge. This creates what I’ll call a denominator effect, with percentages outside of the surge appearing weak when in truth they’re probably just more normal. As an illustration of this denominator effect, the peak sales of December 2021 were 370% of the average from 2018 to 2020 vs. 254% of the entire five year period. Similarly, the 48.1% trough of October 2021 improves to 70.1% when considered versus this 2018 to 2020 period.
It is important to note that this data is not perfect. First, this only represent sales that were recorded in the Miami Association of Realtors Commercial MLS. Regardless, given that this is apples to apples, I believe it is reasonably representative of general trends over time. Also, this is only for sales of properties over $1M.Thus, changes in overall market pricing would affect the numbers. In this case, in what has been a rising market, sales in later years are likely a bit elevated vs. prior years simply because rising prices pushed sales above this threshold on properties than in prior periods would have traded below it. Given the rise of prices over the past five years, there is surely some such effect, particularly when considering 2022 vs. 2018. However, such an effect would likely not be enormous, and would be more at that extreme of the end of the five years vs. the beginning. The aforementioned denominator effect isn’t a data flaw, but could be seen as somewhat of a distortion of ratios. The bottom line, with all of this, as you view these charts, think about the variables, and consider that these charts are perhaps insightful, but (again) not perfect.