
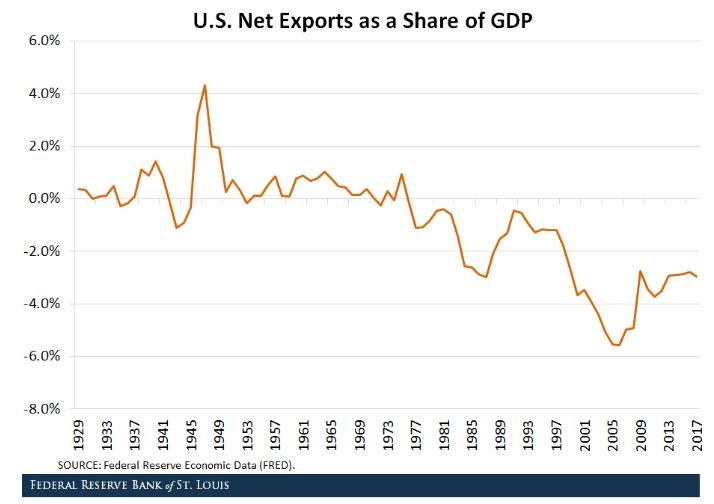
Above is a chart from the Federal Reserve Bank of St. Louis of the net-exports-to-GDP ratio for the United States. Notably, it has been negative since the late 1970s, and for the last decade or two has been considerably less so that its most negative dip in 2005 or so.
Economists have proposed various reasons for the persistence of the trade deficit. One involves sources of income the USA receives from abroad, essentially a differential in returns for overseas investments of American companies versus the returns of foreign investors in the USA (explained here) – one might call it the sucker’s differential – that allows the U.S. economy to consume in excess of what it produces.
Discourse today leads to the question of whether the trade deficit is driven mostly by the trade relationship with a particular country? The chart below, illustrating the composition of the deficit in trade in with the five largest U.S. trading partners of the United States, as seen in the figure below.
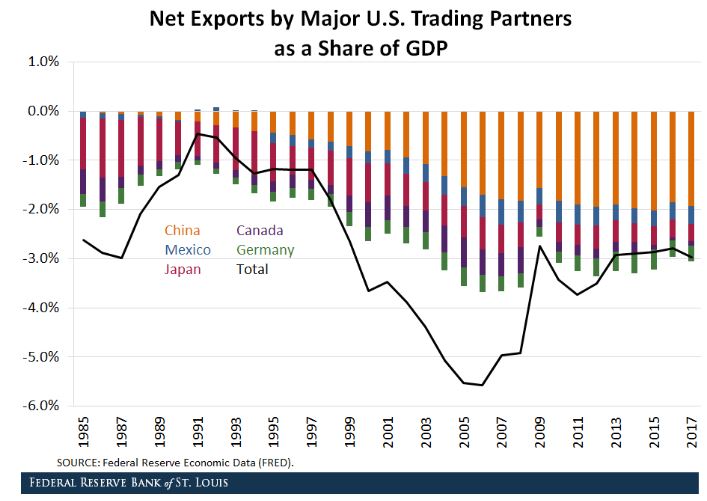
Note that the largest share of the trade deficit in the 1990s originated from trade with Japan, but since 2001 – no surprise here – China’s share in the trade deficit has been steadily growing. China’s entry to the World Trade Organization in late 2001 while Japan experienced stagnation of its economy surely contributed to this. In 2017, nearly two-thirds of the U.S. trade deficit came from trade with China. The trade deficit with China alone was 1.9 percent of GDP of the United States.
Whether a trade deficit is a good or bad thing we’ll leave for others to debate. Surely it is a political debate, as well, which can have affects on policy, in turn on the economy, then on commercial real estate. Thus, investors in commercial property would be well suited to watch this space.