
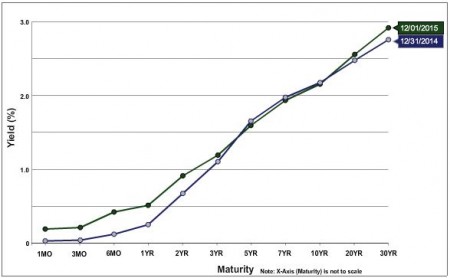
U.S. Treasury Yield Curve December 31, 2015 vs. December 31, 2014
The U.S. Treasury yield curve ended 2015 ever so slightly higher versus the end of 2014, as can be seen in the accompanying “U.S. Treasury Yield Curve December 31, 2015 vs. December 31, 2014” chart. The biggest increase versus the year prior was in 6-month treasuries, with the increase a bit more than 50 basis points. Most maturies, however, had changes that ranged from a small decrease to less than a 25 basis point increase.
This, of course, continues to bode well for commercial real estate investors, as the cost of money to finance transactions remains on the low end historically.
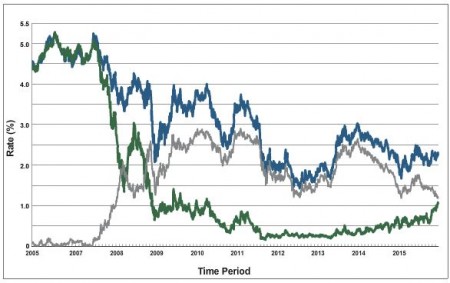
U.S. Treasury Rates 2-year and 10-year 12/31/2005 to 12/31/2015
To provide more context to the current interest rate environment, the second chart (U.S. Treasury Rates 2-year and 10-year 12/31/2005 to 12/31/2015) is of rates for the 2-year (green line) and 10-year (blue line) treasuries over the prior decade. The grey line is the difference between the two.