
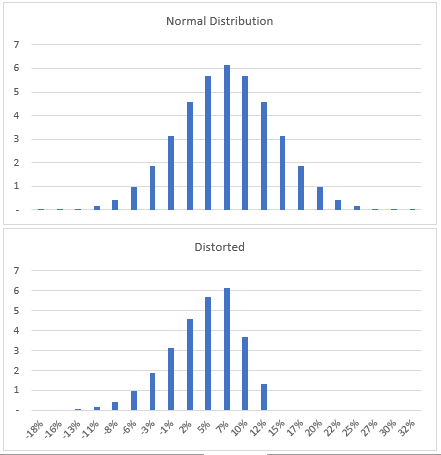
These probability distribution charts are the topic of this article. The first is a normal distribution of returns using a combination of a cap rate of 5% and rent growth of 2% (and assuming an unchanged cap rate a year later) further assuming an annualized standard deviation of returns of 6.5%. The second is how some market participants feel this is in reality now, capped by an environment that doesn’t leave much room for improvement. I’ll return to these further down the post.
First, allow me to do a bit of groundwork.
The returns for commercial real estate are affected by multiple factors. First is the earnings of the property in the form of net operating income (NOI). That is money in the bank (well, assuming rent is paid). Rent growth adds to this in the form on additional money-in-the-bank rental income, but also in terms of increased value. Over time, a property can generally be expected to move in line with its rent growth, plus or minus what follows. If a cap rate is unchanged, value moves up exactly in line with NOI growth.
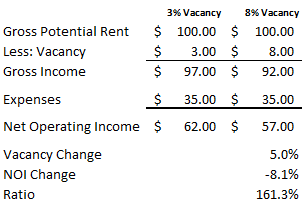
Changes in vacancy rates, or perhaps more accurately changes in assumed vacancy rates, affect NOI disproportionately as not only is rent lost but expense coverage is also lost. For example, if one assumes a building has expenses equal to 35% of gross potential rent, a 5% increase in assumed vacancy from 3% to 8% will decrease that property’s NOI 1.6X as much as the increase in vacancy, like this:
This tends to come into play for all properties. Even a fully leased building with a long-term tenant or tenants should have a vacancy assumption as tenants eventually leave and (sorry to say it aloud) some tenants fail. What assumption is used is a function of what is going on in the markets, thus higher market vacancies will tend to result in higher assumptions for any property.
Then there is the market capitalization rate, commonly referred to as the cap rate. This is the percentage of return buyers demand from earnings (NOI), i.e. NOI / price. Overall market cap rates are affected by a number of things, but the most notable are interest rates and rent growth.
Interest rates affect cap rates as a competing asset class and also by driving demand for property. Commercial real estate does not have only bond like characteristics, however, thus the cap rate does not move exactly in lockstep with interest rates. Over time, cap rates tend to move in line with real interest rates (interest rate less inflation), as cap rates are essentially the real interest rate plus a spread, that of commercial property to some real rate benchmark, generally that of the 10-year US Treasury. on a 1 to 1 basis. In practical terms, over time, this results in cap rates tracking interest rates by about a third. The cap rate to real rate spread moves up and down, but over time is lost in its general trend of tracking real rates.
Rent growth also affects the market cap rate as the more you expect earnings to grow over time the less you are willing to accept now. Miami has experienced and is commonly expected to continue to experience higher rent growth than many markets, and thus has a lower cap rate (i.e. a higher ratio of price to income) than other markets. This growth rate to cap rate relationship tends to be vaguely generalized, but I’d suggest the ratio is about -50%, that for every 1% increase in rent grwoth assumed the cap rate is roughly 0.5% less. If you want to dig deeper into that, I took some time to back that up with some mathematical rationale in a prior post; Quantifying the Effect of Rent Growth Assumptions on Commercial Real Estate Cap Rates. Be warned, there is an Ambien effect.
All this leads to the Goldilocks scenario some believe commercial real estate is in. In order for returns in excess of NOI and rent growth, there needs to be a decline in interest rates either from a decline in rates, an increase in rent growth assumptions, or a decrease in the spread of cap rates to interest rates, or a decline in vacancy rates. Interest rates seem unlikely to go much lower, rent growth seems unlikely to be even stronger, and buildings can’t be more full than full, thus it seems like the return boost possibilities are fairly well all tapped out. The spread of cap rates to interest rates can move, but it does when it does, and there seems no reason to anticipate a move either way, thus I’ll set that one aside. I would also note that buildings can’t get more full than full, but when they want to, rents go up, thus there may be room for rent growth increases. Regardless, on balance, many suggest that the variables that can really push returns are fairly well tapped out. Given this, there is an exchange of ownership underway from those with an inclination toward market timing to carry traders, investors that buy to capture the spread between NOI and interest rates.
Now, to return to the chart at the top, the probability distribution charts. The top one uses 7%, the sum of an assumed market cap rate of 5% and assumed market rent growth of 2%, as a mean return, then plots a normal distribution of possible annual returns using a standard deviation of 6.5%. That SD is more addressed in a paper by S&P Down Indices and another by a trio of University of North Carolina and Indiana University professors. From these, I settled on 6.5%, but I could have chosen a bit higher or lower.
The second chart is this same distribution with some capping math applied as one exceeds the mean return. This is not to show some set of true probabilities, but to graphically note what some investors perceive as the range of possibilities in the current environment. This is how a trading type commonly views trades, that probabilities can be skewed in certain situations putting the odds of taking some position in the trader’s favor. But for that, traders would not trade. I can tell you from conversations with some commercial real estate buyers that some see the current environment as much more left/negative leaning than this. However, not a small number have been saying this for years, if not decades. It may be that they’re eventually right, but it also might only be that eventually reality steps two sigma in the direction of their prediction.
Back in my Wall Street days, a fellow Financial Advisor in my office once commented how much money he had seen lost by people trying to avoid the next bear market. Somewhat contrary that comment is the reply by Bernard Baruch when asked what was the key to his trading success; “I buy my straw hats in the winter time.” What’s the answer? What will actually happen? To “answer” that, I’ll tap into the superseding wisdom of baseball legend and and everyman philosopher Yogi Berra; “It’s tough to make predictions, especially about the future.”