
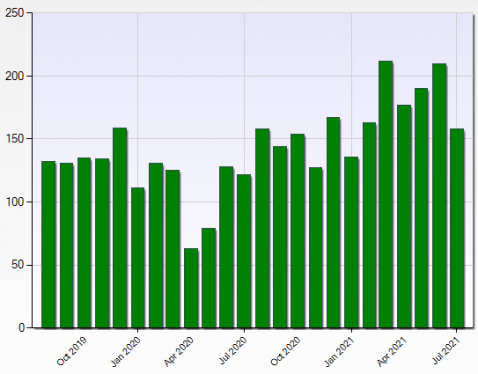
This chart displays the number of closed commercial property sales in Miami-Dade county and the cities, including both improved commercial properties and vacant commercial land, that were recorded in the Miami Commercial MLS for the two years ending July, 2021. The number for last month, July 2021, seems to have reverted to more of a normal, non-pandemic, level, after surging in recent months to (presumably) make up for lost time.
We can chart our future clearly and wisely only when we know the path which has led to the present.
“We can chart our future clearly and wisely only when we know the path which has led to the present.”
Adlai Stevenson I
Note that this is only for sales that have been booked in the Miami Multiple Listing Service (MLS), which does not record all commercial property sales. It does, however, record many of them. This is best considered not as a measure of all commercial sales but instead to compare, apples to apples, sales booked within the commercial MLS to prior periods (again booked within) to gauge trends in Miami area commercial real estate sales activity.
One can further gauge the relative strength of the market by viewing a chart of (this month’s) July 2021 sales to list price ratio for Miami-Dade commercial real estate. For an idea of how much commercial real estate tends to trade in the area, see our post where we chart estimated turnover for Miami-Dade commercial property from 2016 to 2020.