
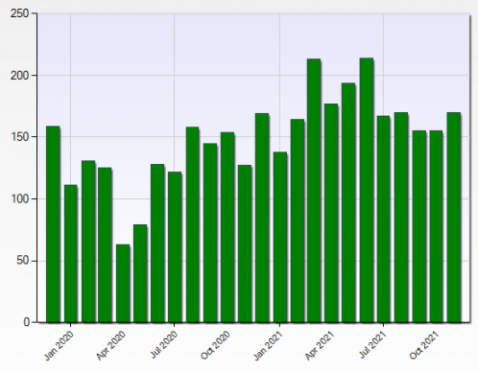
The chart herein displays the quantity of closed commercial property sales within the county of Miami-Dade, including both improved commercial properties and vacant commercial land, that were recorded in the Miami Commercial MLS for the two years ending November of 2021. November’s volume up a bit versus the prior month. As has been the case of late, but for a couple of post COVID surge months, volume was in line with its range for the past several months.
Note that this chart only includes sales that have been booked in the Miami Multiple Listing Service (MLS), which does not record all commercial property sales. It does, however, record numbers of them. This is best considered not as a measure of all commercial sales but instead to compare, apples to apples, sales booked within the commercial MLS to prior periods (again booked within) to gauge trends in Miami area commercial real estate sales activity. To get an idea of how much commercial real estate tends to trade in the area, see our post where we chart estimated turnover for Miami-Dade commercial property from 2016 to 2020.