
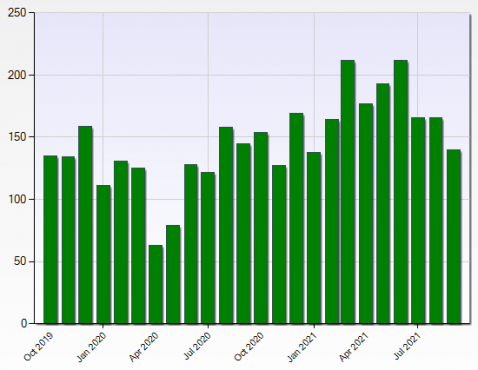
This chart displays the number of closed commercial property sales in Miami-Dade county including both improved commercial properties and vacant commercial land, that were recorded in the Miami Commercial MLS for the two years ending September, 2021. The September 2021 volume dropped off a bit versus prior months and was 3.4% lower than the same month a year prior, but seems nonetheless to be in a normal range.
“Buy land, they’re not making it anymore.”
~ Mark Twain
Note that this is only for sales that have been booked in the Miami Multiple Listing Service (MLS), which does not record all commercial property sales. It does, however, record many of them. This is best considered not as a measure of all commercial sales but instead to compare, apples to apples, sales booked within the commercial MLS to prior periods (again booked within) to gauge trends in Miami area commercial real estate sales activity. To get an idea of how much commercial real estate tends to trade in the area, see our post where we chart estimated turnover for Miami-Dade commercial property from 2016 to 2020.