
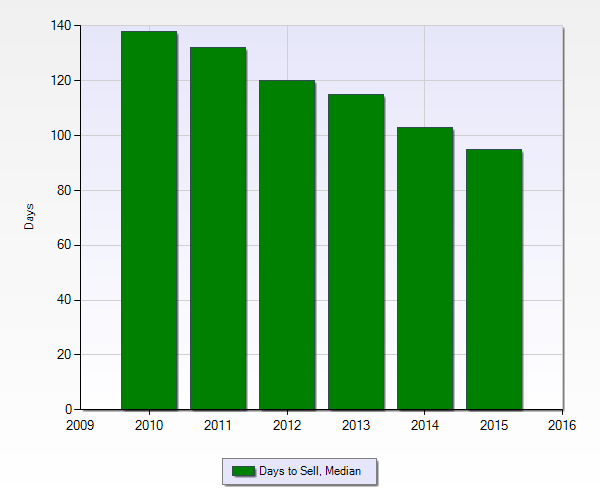
It is usually the case that when one views a chart of some variable, the chart goes up and down erratically. Of notable exception is the MLS chart, shown here, of average days to sell commercial property in Miami-Dade County for the six years from 2010 to 2015. Not only have the days to sell declined in each of these years, they have done so in an eerily consistent manner.
Stated as a percentage of decline from the prior year’s days to sell, the declines in 2011 forward are 4.3%, 9.1%, 4.2%. 10.4%, and 7.8%, a set of numbers with a standard deviation of 2.8%. To put this standard deviation into perspective, consider that it is about a seventh (yes, 1/7, as in 6/7 less) of the long-term standard deviation of the S&P 500.
As far as we can tell, there is nothing particularly useful about the consistency of this decline for considering buying or selling decisions with regard to commercial real estate. More than anything, it is simply surprising, so much so as to feel unnatural, and so much so as to leave us wondering. Perhaps this is a feature of the steady march of transaction pace in an extended low rate environment? Or, maybe this is a feature of a city ascending, as Miami has clearly been doing in recent years.