 48-Story Solitair Brickell Gets $108M Construction Financing From JP Morgan Chase, Work Begins
Two prominent Wall Street firms are betting on Brickell’s booming apartment market. Yesterday, JP Morgan Chase issued a $108.35 million construction loan to build the 438-unit Solitair Brickell at 86 SW 8 Street, where demolition of a parking ramp began today. AIG, another big Wall Street firm, is also involved with the project…
ZOM lands $108M construction loan for apartment tower on Brickell
An affiliate of ZOM secured a $108.35 million construction loan for a 46-story apartment tower in Miami’s Brickell financial district. JPMorgan Chase Bank (NYSE: JPM) granted the mortgage to Brickell Bayview Owner, an affiliate of the Orlando-based developer and partner AIG Global Real Estate. Construction of the 420 unit project…
Take an early look at the new Miracle Mile
The New York-based design firm brought on to revitalize Coral Gables’ Miracle Mile has released new renderings of what the four-block stretch will look like when completed. Cooper, Robertson & Partners was hired by Coral Gables to bring its long discussed $20 million streetscape improvement plan to life. City commissioners approved…
Former Power Studios site in Design District sells for $14M
Power Studios’ former site in Miami’s Design District has traded hands for $14 million, with plans to develop it into a two-story retail and entertainment venue, The Real Deal has learned. A partnership, majority owned by former banker Leonard Abess, as well as Chariff Realty Group…
SLS South Beach hotel sells for $125 million
A company affiliated with Los Angeles-based investment real estate company CIM Group sold the SLS South Beach for $125 million this week. The seller of the 140-room hotel is a group called 1701 Collins Miami Owner. The buyer is similarly calling itself 1701 Miami Owner. It is a company affiliated with Daniel Tain and Marco Ferri…
Miami Developers Forced to Market Condos to Actual Americans
Developers of luxury condo high-rises in Miami have had it pretty good for the past few years. Grab some famed starchitect, give your property some outrageously expensive and kind of silly amenities, slap a vague name on it like 2200 Ocean, and then just sell a bunch of condos to foreigners to use as investment properties…
Hialeah is Attempting to Create its Own Arts District
As many journalists, bloggers and fiercely loyal locals like to report, Miami is in the midst of a cultural renaissance. Of course, in any renaissance, art is a key ingredient, and artists need somewhere to live. But with the prices in Wynwood out of reach and rents rising rapidly in downtown, Miami’s evolution has some seriou…
Bay Harbor Islands preservation battle heats up
A divided Bay Harbor Islands town council passed a resolution late Monday calling on the Miami-Dade County Commission to overturn historic designation status for the Bay Harbor Continental, a cooperative apartment building with 35 units in Bay Harbor Islands. The council passed the resolution 5-2…
Plans nixed: 18 proposed townhouses for U.S. 1
A proposal to transform four single houses and two vacant lots into 18 townhouses on U.S. 1 near Miami Science Museum is now dead. At its May 28 Planning and Zoning Board hearing, the Miami City Commission unanimously denied the rezoning of the properties to allow for the larger project…
Urban Environment League: How the 63 story LED billboard tower would really look
Dear Mayor Regalado, Thank you for speaking with me last night in regard to “Innovation Tower”, the proposed 633-foot LED billboard for downtown Miami. As our leader, we’re going to need your help in the next few weeks to defeat this awful idea. You understand how bad this Eternal TV in the Sky will be for our city. We can’t let…
Sawgrass Mills unveils expansion plans for Town Center
Sawgrass Malls is getting another huge open-air expansion, this time a full-price retail section, owner Simon announced Tuesday. Town Center at Sawgrass will span 118,000 square feet and host about 25 full-price retailers, along with four new sit-down restaurants. A new parking deck will accompany…
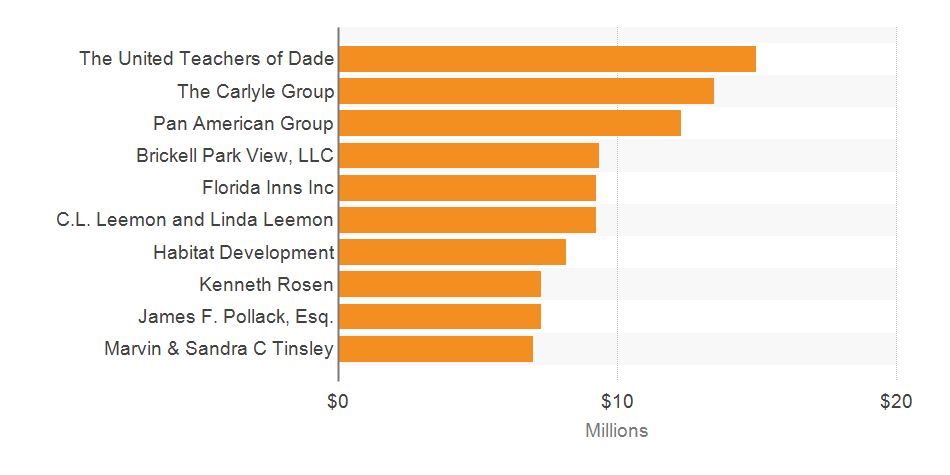
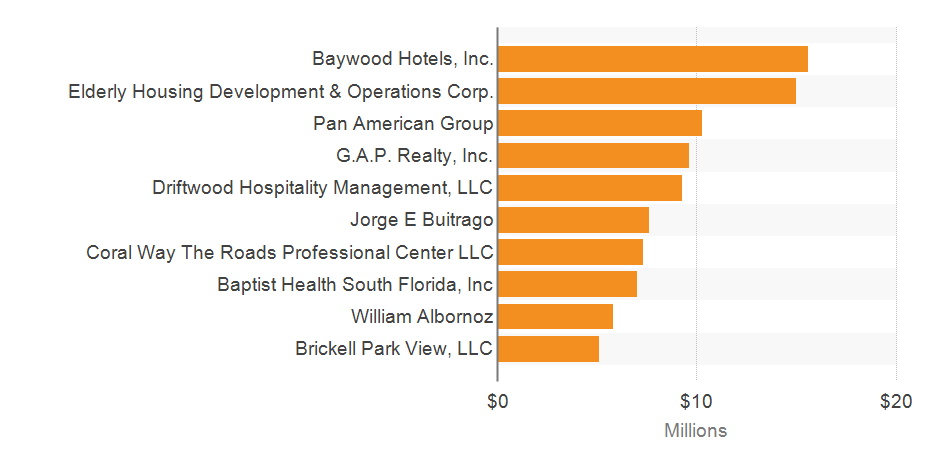
Top Commercial Real Estate Buyers and Sellers in Miami’s 33129 Zip Code
Top buyers identified by Costar for commercial property in Miami’s zip code 33129 include: United Teachers of Dade; The Carlyle Group; Pan American Group; Brickell Park View LLC; Florida Inns Inc.; C.L. Leemon and Linda Leemon; Habitat Development; Kenneth…
Inked: 10-Year, 25,000 SF Lease Deal With Printing Company
Over the past eight months, CBRE has arranged the sale of over 200,000 square feet and has executed leases totaling over 280,000 square feet at the Fort Lauderdale Commerce Center, where MOR Printing will call home.
Miami-Dade considers Wynwood land swap with Moishe Mana for Puerto Rican Community Center
Miami-Dade County is considering a land swap with developer Moishe Mana in Wynwood to build a Puerto Rican Community Center and other government offices. The county commission’s Economic Prosperity Committee will vote on the deal with Mapton Holdings, managed by Israeli developer Mana…
Rising Labor Costs Means Higher Construction Costs For 2015
According to Chicago’s award winning Leopardo Companies annual industry report Construction and Economics Report and Outlook, the low price of oil is reducing the cost of construction. Unfortunately at the same time, a lack of skilled labor…
Coral Gables seeking developers to expand parking garages near Miracle Mile
The city of Coral Gables has issued a request for proposals seeking a developer to expand two parking garages, and potentially add commercial space, just off its popular Miracle Mile strip. The city document said the development could have up to 315,000 square feet of mixed uses in addition to public parking facilities. Coral Gables has…
Sawgrass Mills to undergo another big expansion with Town Center project
Sawgrass Mills will undergo yet another expansion with the launch of its Town Center at Sawgrass project, Simon announced Tuesday. The new 118,000-square-foot area will have four sit-down restaurants, 25 “full-price” retailers as opposed to discount stores, and a parking deck that can hold 2,000 cars. it will also have areas…
No consensus on next big Miami transit move
Everyone acknowledges that something must be done to address South Florida’s growing transportation gridlock, but there is very little consensus on next moves. “There’s no appetite to go to the voters and ask for more money,” said Esteban Bovo Jr., a Miami-Dade County commissioner who was a panelist at a critical issues panel…
Yet Another Lawsuit Filed In Opposition To Worldcenter
Developer Martin Margulies filed suit last week against the city of Miami and Southeast Overtown/Park West Community Redevelopment Agency over the $88 million Tax Increment Financing.
Former Power Studios site in Design District sells for $14M
3711 Northeast Second Avenue. Power Studios’ former site in Miami’s Design District has traded hands for $14 million, with plans to develop it into a two-story retail and entertainment venue, The Real Deal has learned.
A partnership, majority…
First new South-of-Fifth condo project completed at time of slowing resales
The first of at least eight new preconstruction condo projects planned for the ultra-luxury South-of-Fifth neighborhood of South Beach has been completed, at a time when the pace of unit resales is slowing. The first transaction deed for a condo in the newly completed…
Can Miami Developers Learn From This Retail Project?
Kane Realty saw opportunity where others saw an aging retail area. Could Miami retailers take a page from this strategy?
TotalBank sells repossessed Miami condos at 38% discount
TotalBank sold eight repossessed units in the Venetia Condominium in Miami at a 37.5 percent discount. The Miami-based bank seized the condos at 55 N.E. 15th Street from E.T.C. Workshop in 2011 after foreclosing on a $4.4 million mortgage. Four years later, TotalBank affiliate Yellow Leaf Development sold them for $2.75 million…
Boca Raton company acquires 24 Walgreens-leased properties for $92 million
Boca Raton-based investment firm The Herrick Co. announced that affiliates of the company acquired 24 Walgreens-leased retail properties throughout the U.S. The pharmacy/retail locations, which the company says has long-term leases, were acquired for $92 million.
Local 10 Video: Groups fight for 4-acre parkland behind AmericanAirlines Arena
A group of open-space activists are planning the first picnic in Miami-Dade County’s so-called Parcel B Saturday, hoping to bring attention to 20 years of broken promises at the 4-acre waterfront site. “Interested groups are fighting a little more aggressively to get this 4-acre site turned into a park — the waterfront park that it should be,” said…

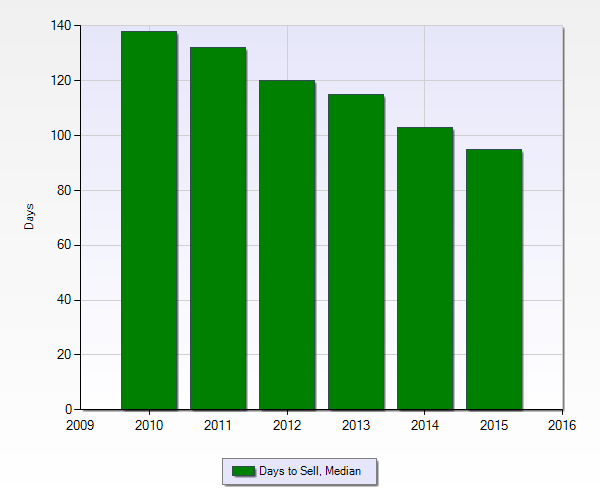
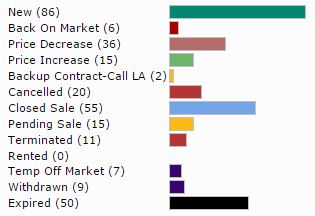
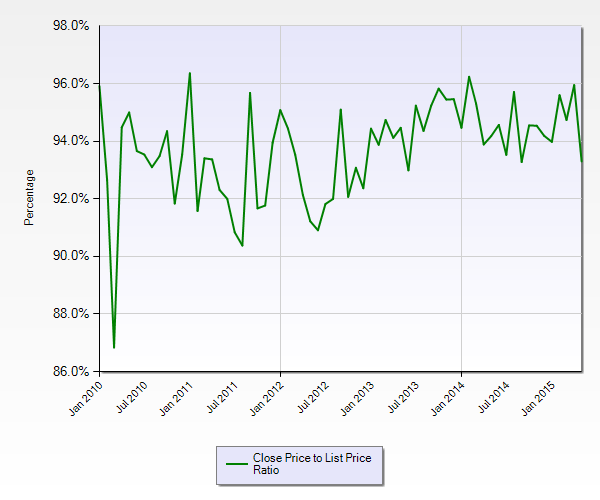
 The Q2 2015 update of the Residential Real Estate Market Study of the Miami Downtown Development Authority has been released . This is a a continuation of their Q1 2015 (Annual) market research report. Some of their findings in this most recent report include: